


Accidental Deaths in India - Part 2
Deaths by accidents

In the previous post, I spoke about the accidental deaths caused by Forces of Nature.
Just to recap,
Accidental deaths caused by forces of nature while significant (8,060 deaths in 2022), contribute to only about 2% of all accidental deaths. The remaining 98% of accidental deaths are attributable to human negligence, errors or in some way affected by actions of humans.

So in this post, we look at this 98%.
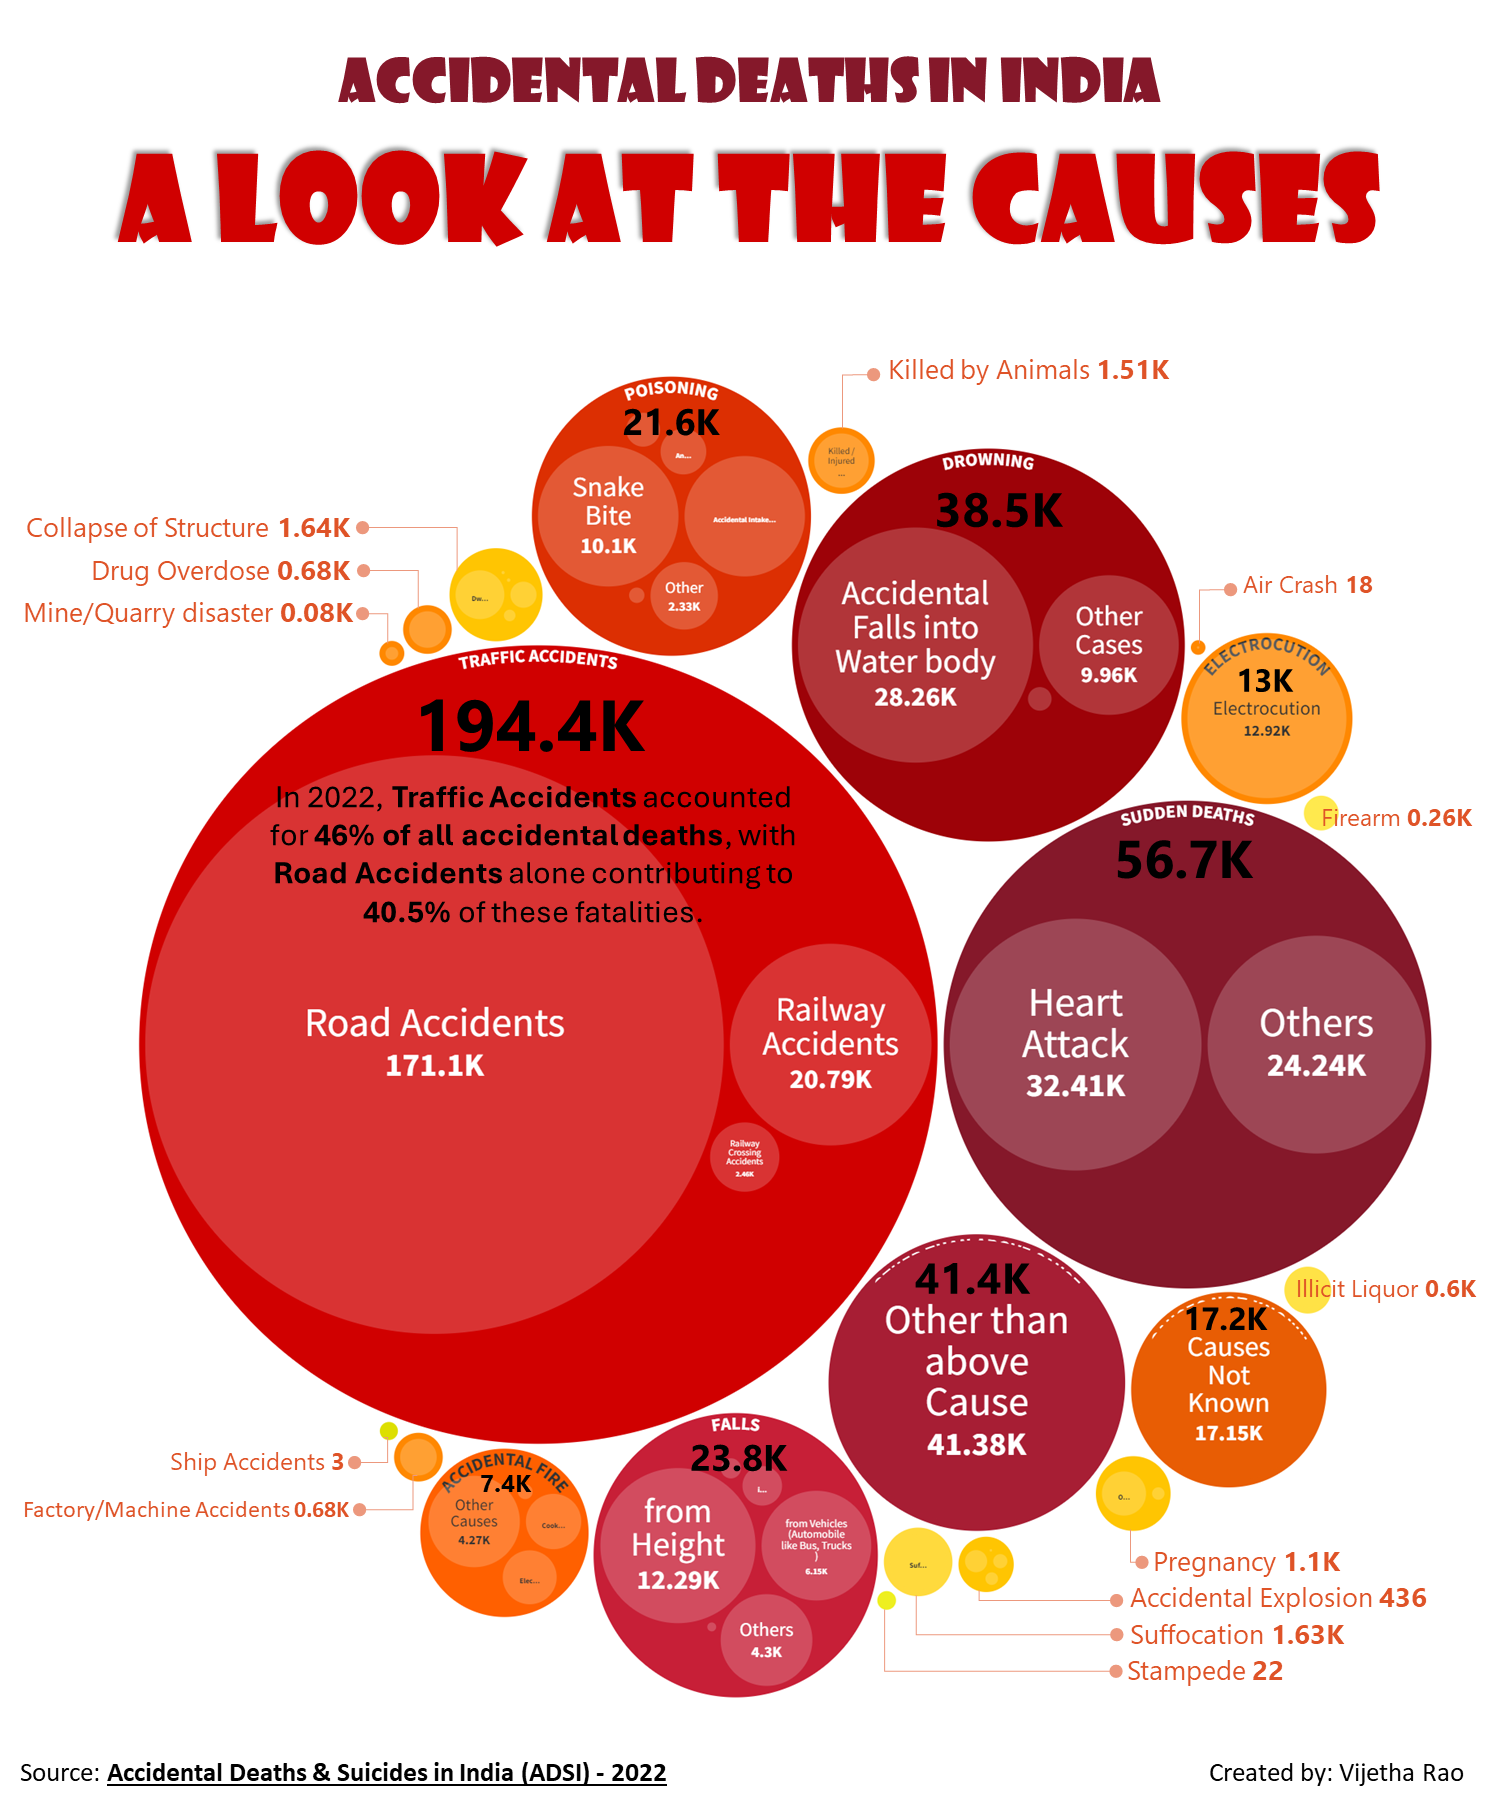
In 2022, India lost 422,444 lives to Accidental Deaths, excluding those caused by Natural causes. The leading contributors to these accidental fatalities included traffic accidents, sudden deaths (such as heart attacks), drowning, accidental fires, falls, and poisoning.
Accidents are an unfortunate reality that impacts countless lives every year, and understanding the data behind these tragedies could be crucial for prevention and policy-making.
Here I attempt to provide a breakdown of these numbers - how they vary across states, what are the major causes and exploring which one is the Big Killer?
State-Wise Accidental Deaths
This visualization provides a snapshot of how these figures are distributed across different states. Maharashtra saw the highest number at 66,211, followed by Madhya Pradesh and Uttar Pradesh.

Breakdown of Causes
But what’s behind these numbers?
My second visualization breaks down the causes behind these accidents. It’s particularly alarming to find that nearly half of all accidental deaths are due to traffic accidents. This clearly highlights the urgent need for enhanced road safety measures.
The visualization offers a detailed breakdown of various contributing factors. Traffic accidents emerged as the leading cause, accounting for 46% of all accidental deaths.
The Big Killer
Road Accidents - 171,100 deaths and 423,158 injured.
Taking a closer look at road accidents, the data reveals some striking details.
Uttar Pradesh, for instance, has the highest number of road accident deaths at 24,109. Additionally, two-wheeler vehicles are a major concern, responsible for 77,876 deaths and nearly 200,000 injuries.
Let’s take a closer look at road accident numbers across states, including the modes of transport most frequently involved in these incidents.

A look at the road types where these accidents are occuring also is interesting.
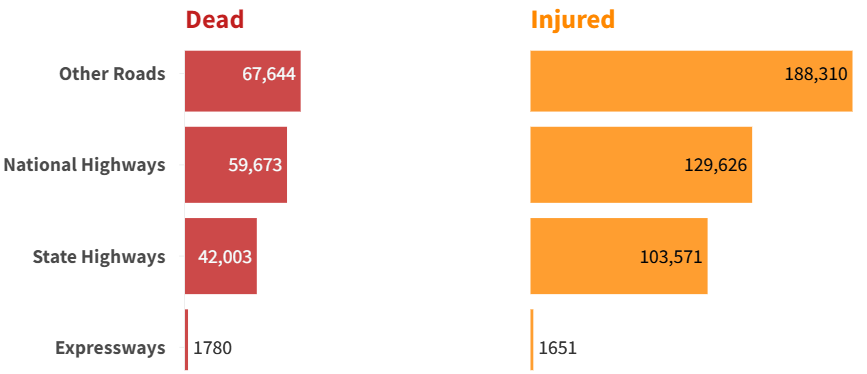
Delving deeper into the data for road accidents brings out some revealing details.
Unsurprisingly, over speeding comes on the top of the causes that result in these road accident fatalities with an unstounding 100,726 deaths attributed to this alone!

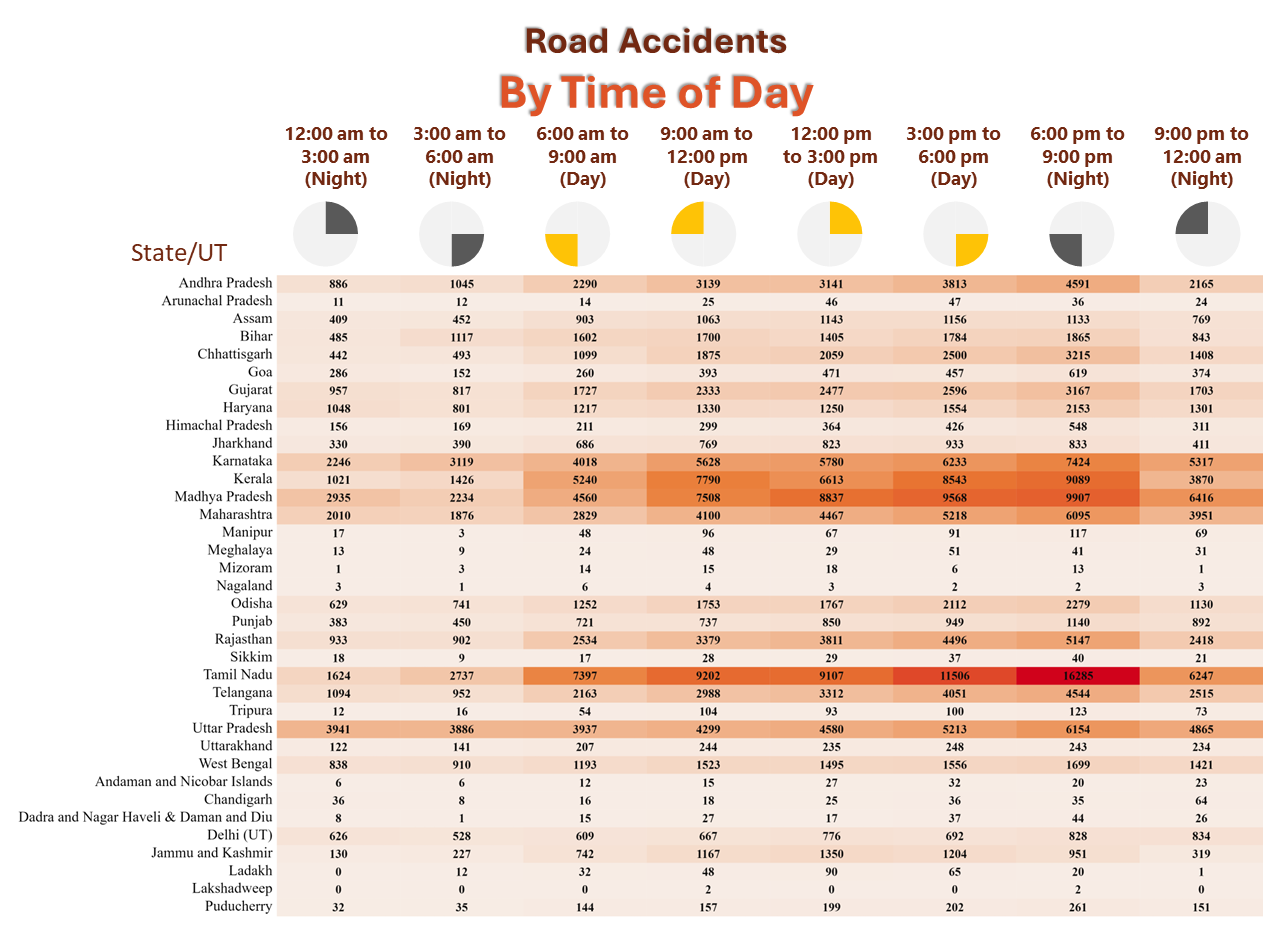
The data also brings in the time of day when these accidents happen which is the most surprising for me. While I would have imagined the night 12:00 am to morning 6:am time to be the most dangerous one, the data reveals something different.
The time between 6:00 pm to 9:00 pm at night seems to be the period which sees the most accidents, followed by the 3:00 pm to 6:00 pm period.
The Accidental Deaths and Suicides in India (ADSI) - 2022 on the data.gov.in site offers several more parameters to evaluate and draw insights with respect to this data, if you wish to explore it further.
These insights underscore the importance of addressing specific safety issues to prevent future tragedies.
As we navigate India’s chaotic roads, one can’t help but wonder:
How many two-wheeler riders zip past without helmets every day, despite the risks? How many cars on our streets truly meet the required safety standards?
And how many potholes, bumps, and poorly designed dividers will it take before we demand necessary changes?
The pressing need for better road safety and vehicle standards is clear, but by when?
I invite you to check out the visualizations and share your thoughts.